When he starts a column with the phrase “underneath the apparent stability of the Great Moderation lurked a rapid rise in debt that is now being unwound”, and uses this graph as evidence

, then someone who is as much of a fan of FRED as I am is going to want to reproduce Krugman’s data, whence we end up with
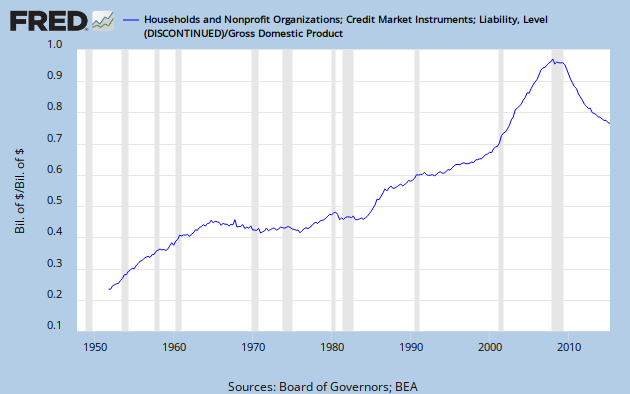
I’ll grant that something especially crazy started happening around the year 2000, but I don’t think you’d really single out that particular era, if this graph were your only bit of evidence, and say, “Ah ha! Debt really became unsustainably large right there!” Debt has been increasing continuously since the 1950s. The point of Krugman’s article lies in other directions (namely, how much of a hit on future GDP we’ll take because the country is now deleveraging), but my question would be: how far do we have to fall? Back to where it was in 1999? Or back to where it was in 1960?
